Determine anonymously who is in any area
Data-based decisions across every department
Smart workplace planning starts with data, not guesswork. InnerSpace gives you real-time insights into how your spaces are actually used, so you can make informed decisions that align with employee behavior, improve space efficiency, and support evolving hybrid strategies.
When you plan with data, every square foot works harder.

Are you designing your workplace around how people actually work?

Office use has changed - understanding its impact on space design and productivity is critical. You can rely on assumptions, or use data that makes it clear.
Great workplace design starts with understanding human behavior. It’s not just about desks and meeting rooms, it’s about movement, interaction, and intent.
If you want your workplaces to support productivity, connection, and well-being, you have to understand what people actually do when they’re in the office. That’s where InnerSpace comes in.
The InnerSpace Impact
“With InnerSpace we can easily understand the economics of every square foot within our business and make better decisions on how to utilize our space. The opportunity for growth is massive and they’ve cracked the code.”

Drive confident decision making with reliable, accurate, objective and always on data.

DWELL TIME
- How long employees or visitors spend in specific areas.
- Identifies high-traffic zones vs. underutilized spaces.
- Captures patterns of space usage throughout the day.

MEETING ROOM UTILIZATION
- Frequency and duration of meeting room usage.
- Identifies underused or overbooked rooms.
- Tracks no-shows and abandoned bookings.

MOBILITY PATTERNS
- Collaboration patterns through mobility data to inform smarter organizational design
- Tracks common pathways, congestion points, and bottlenecks.
- Identifies which spaces encourage movement and collaboration.

OCCUPANCY TRENDS
- Real-time and historical space utilization.
- Tracks peak and low-traffic periods.
- Identifies patterns in office attendance over time.
Data visualization made simple

User-friendly interface
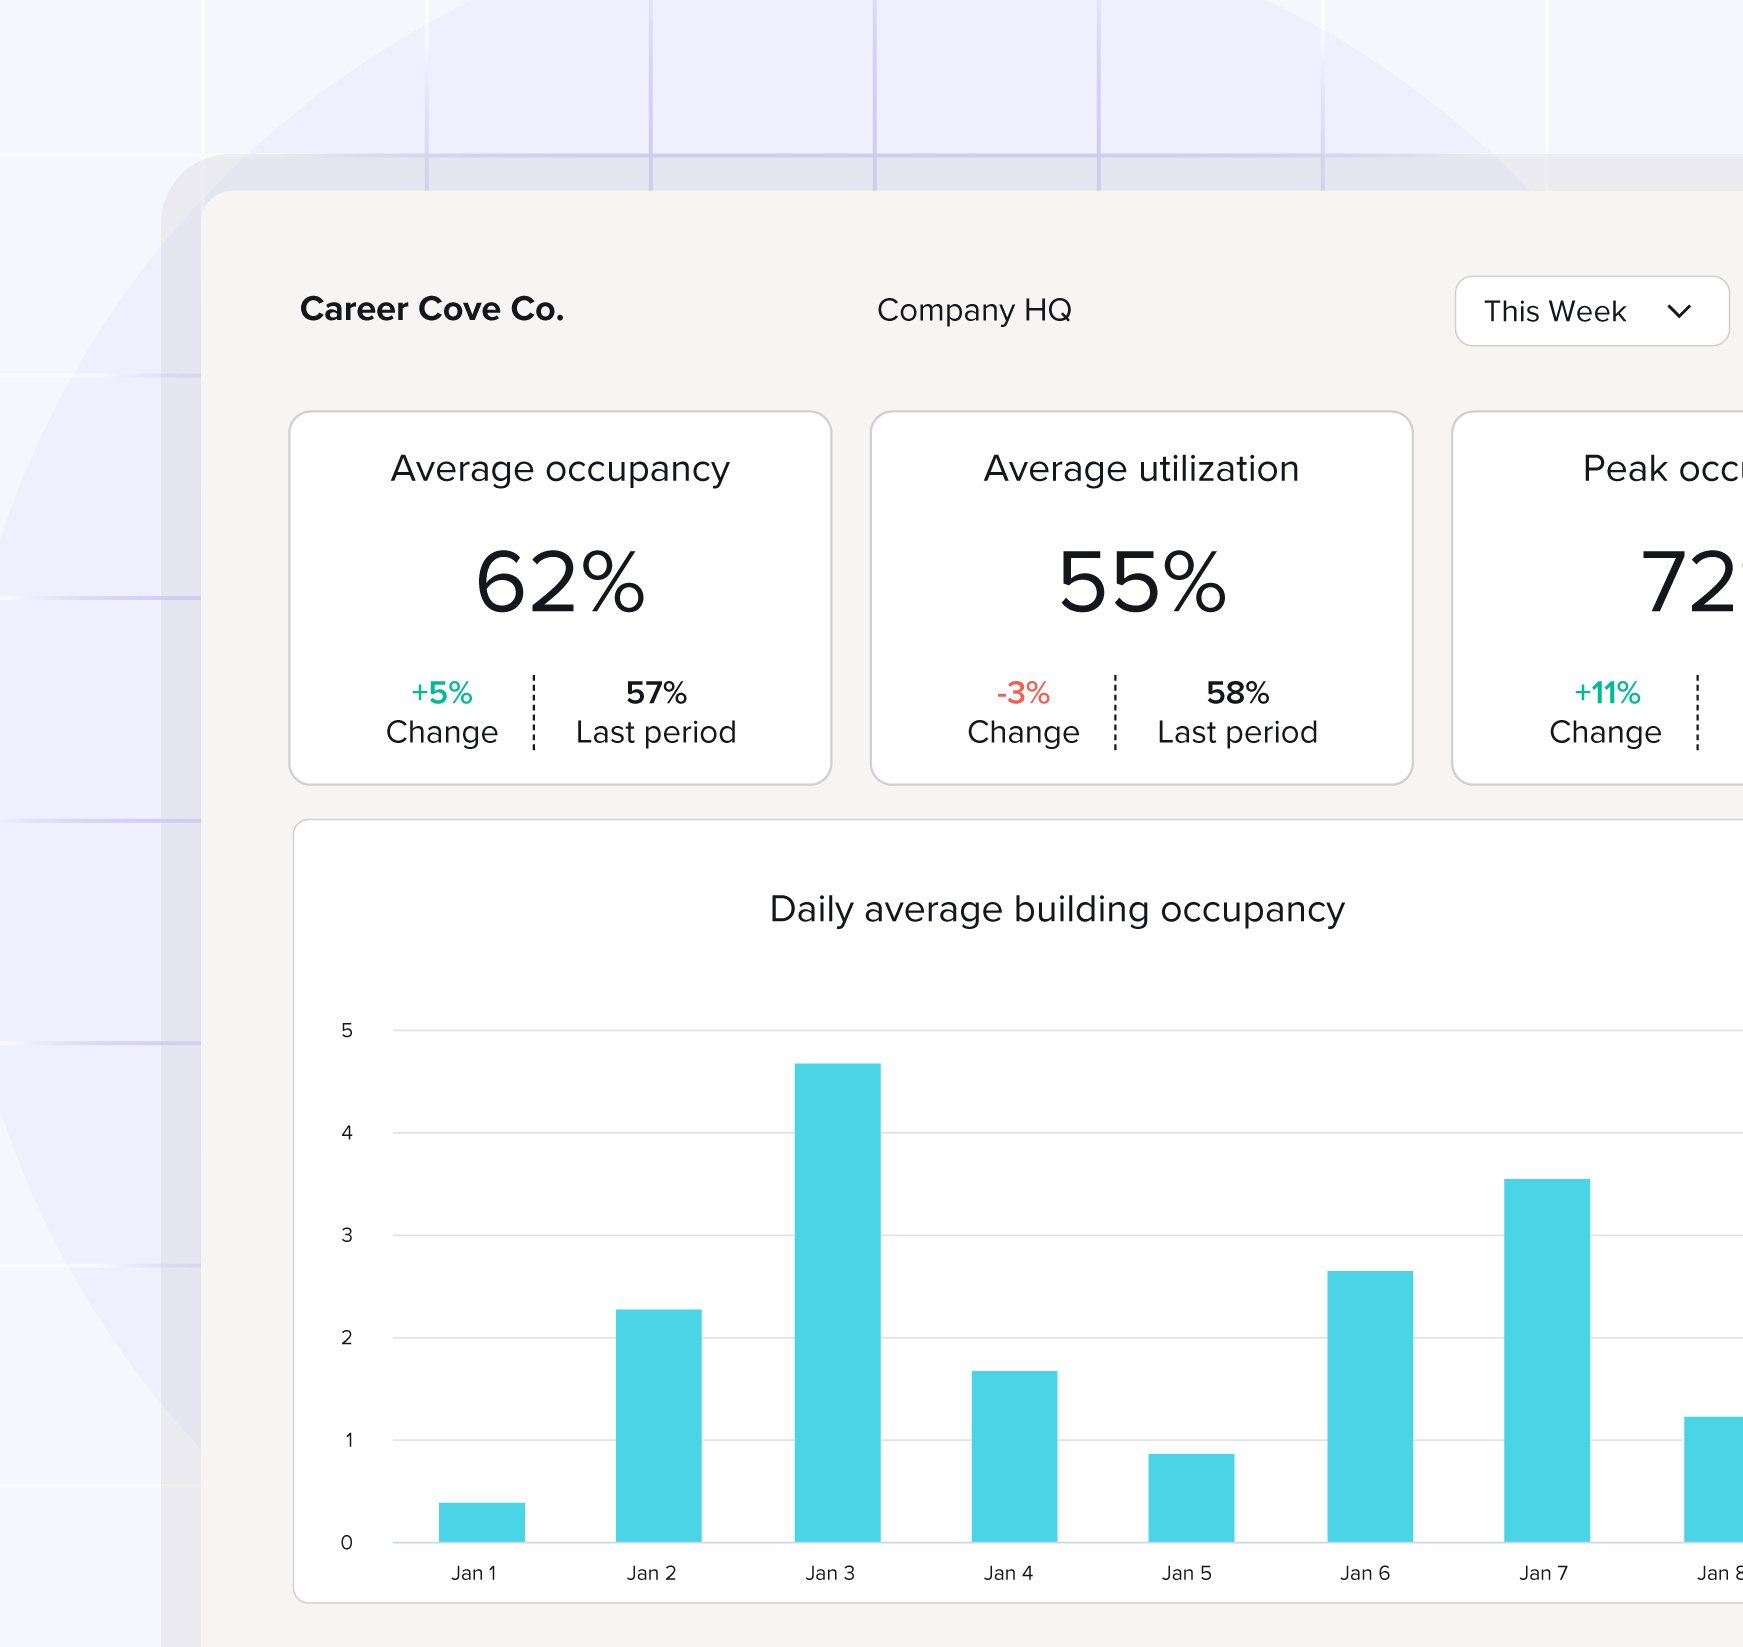
The InnerSpace Portal features a series of simple ‘cards’ presenting answers to common questions about space usage. This at-a-glance simplicity is augmented with detailed charts and graphs that present the full spectrum of historical data for reference over periods of time.

Intuitive dashboard design
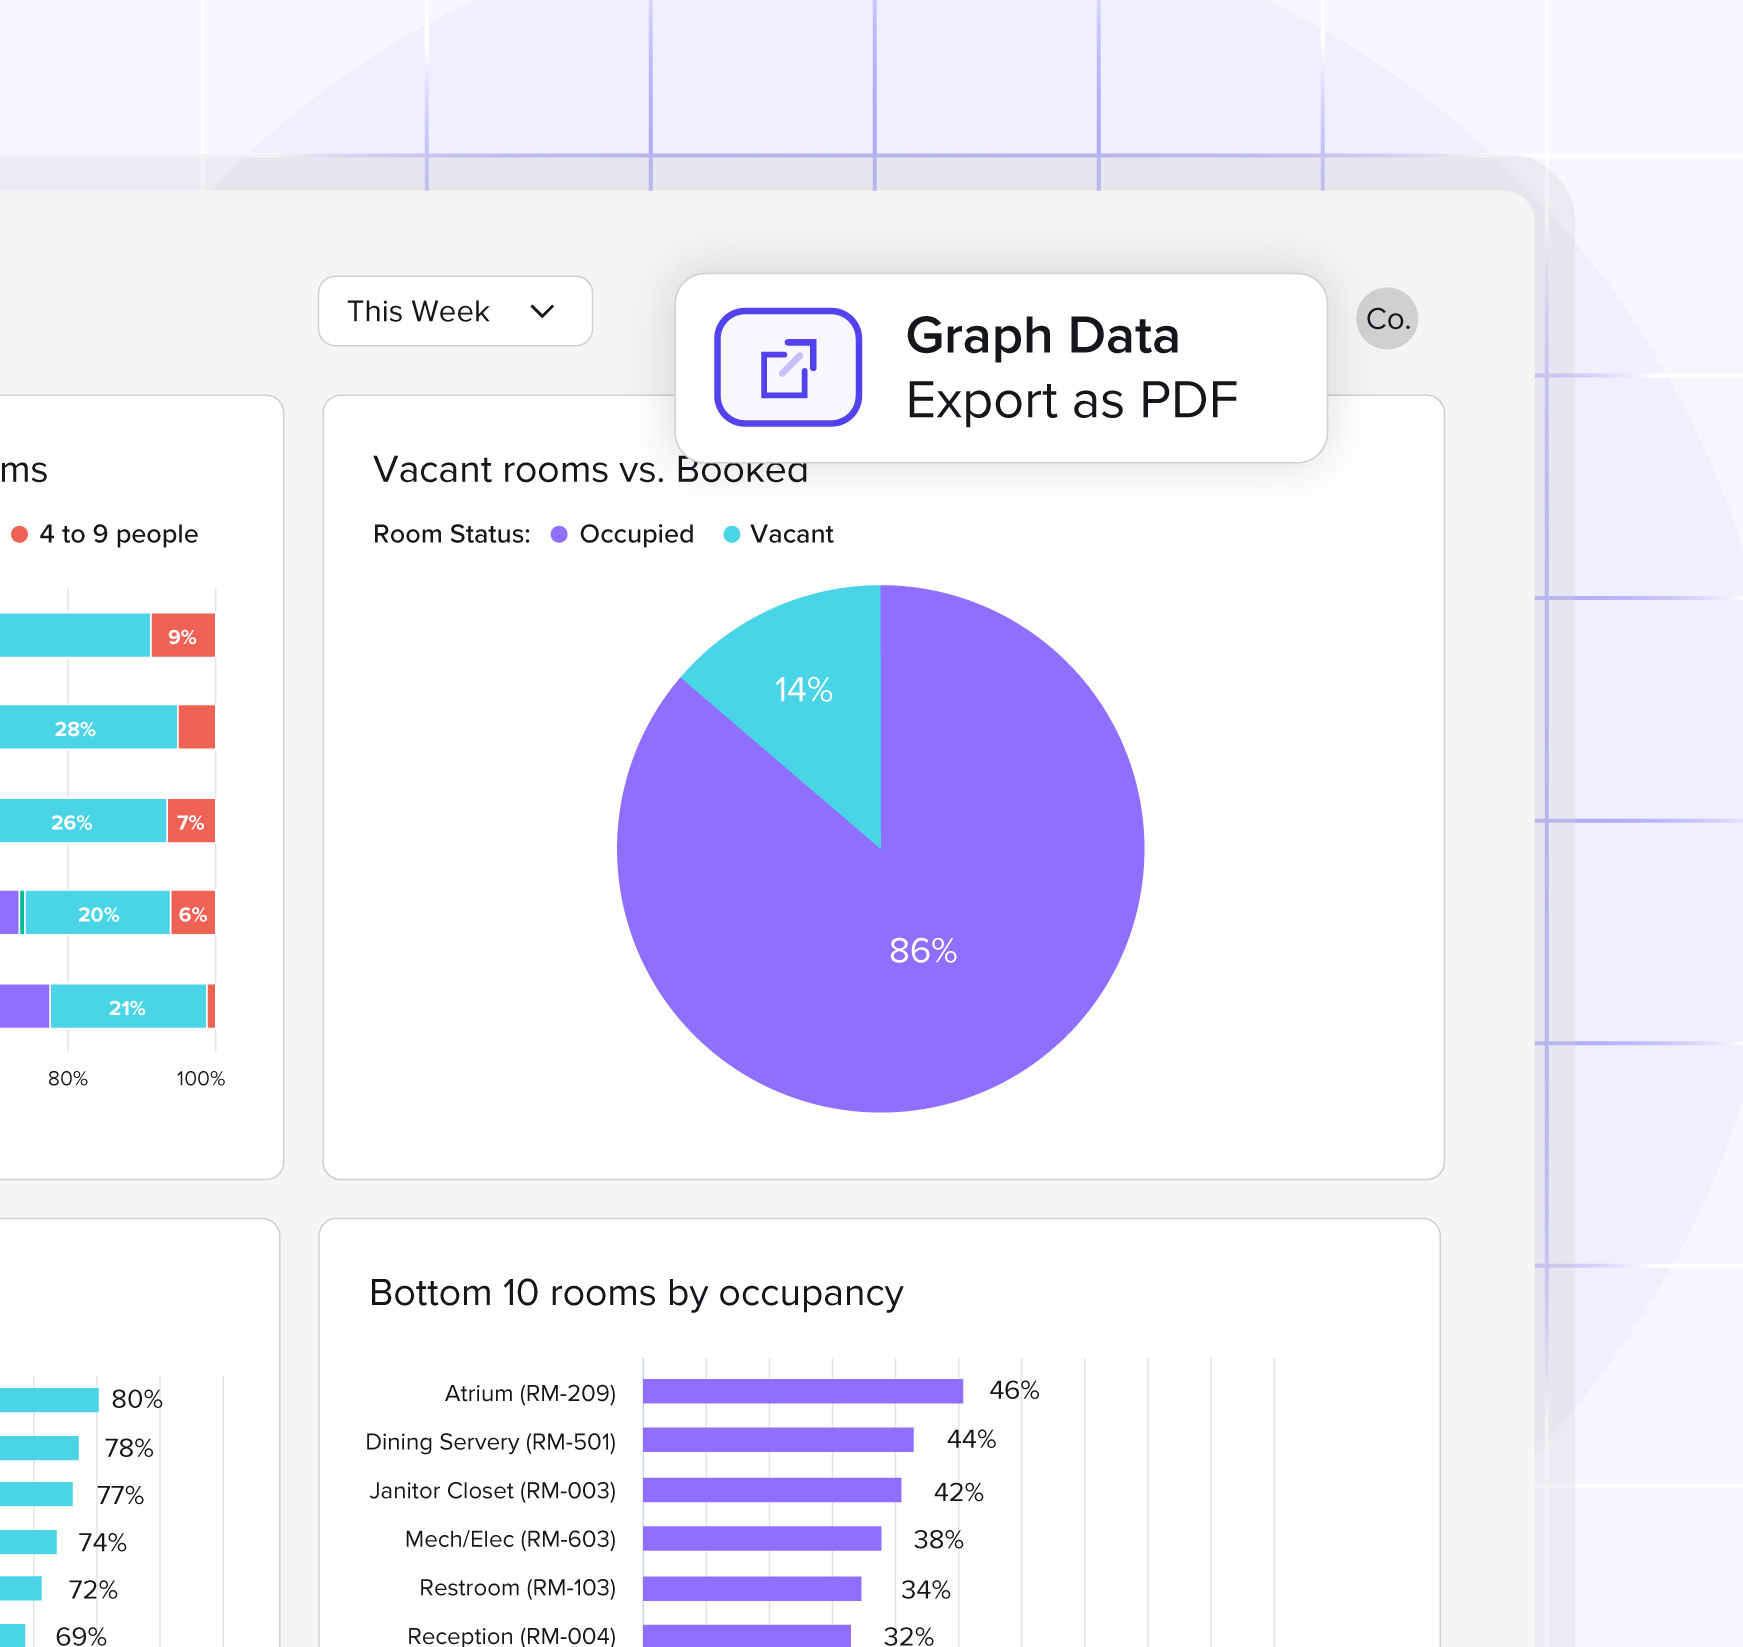
An intuitive dashboard design empowers users to select the most important metric to them and export data for their own reporting needs. All graphs and charts in the InnerSpace Portal are available for CSV download, along with a high-level summary PDF report to share with key stakeholders.

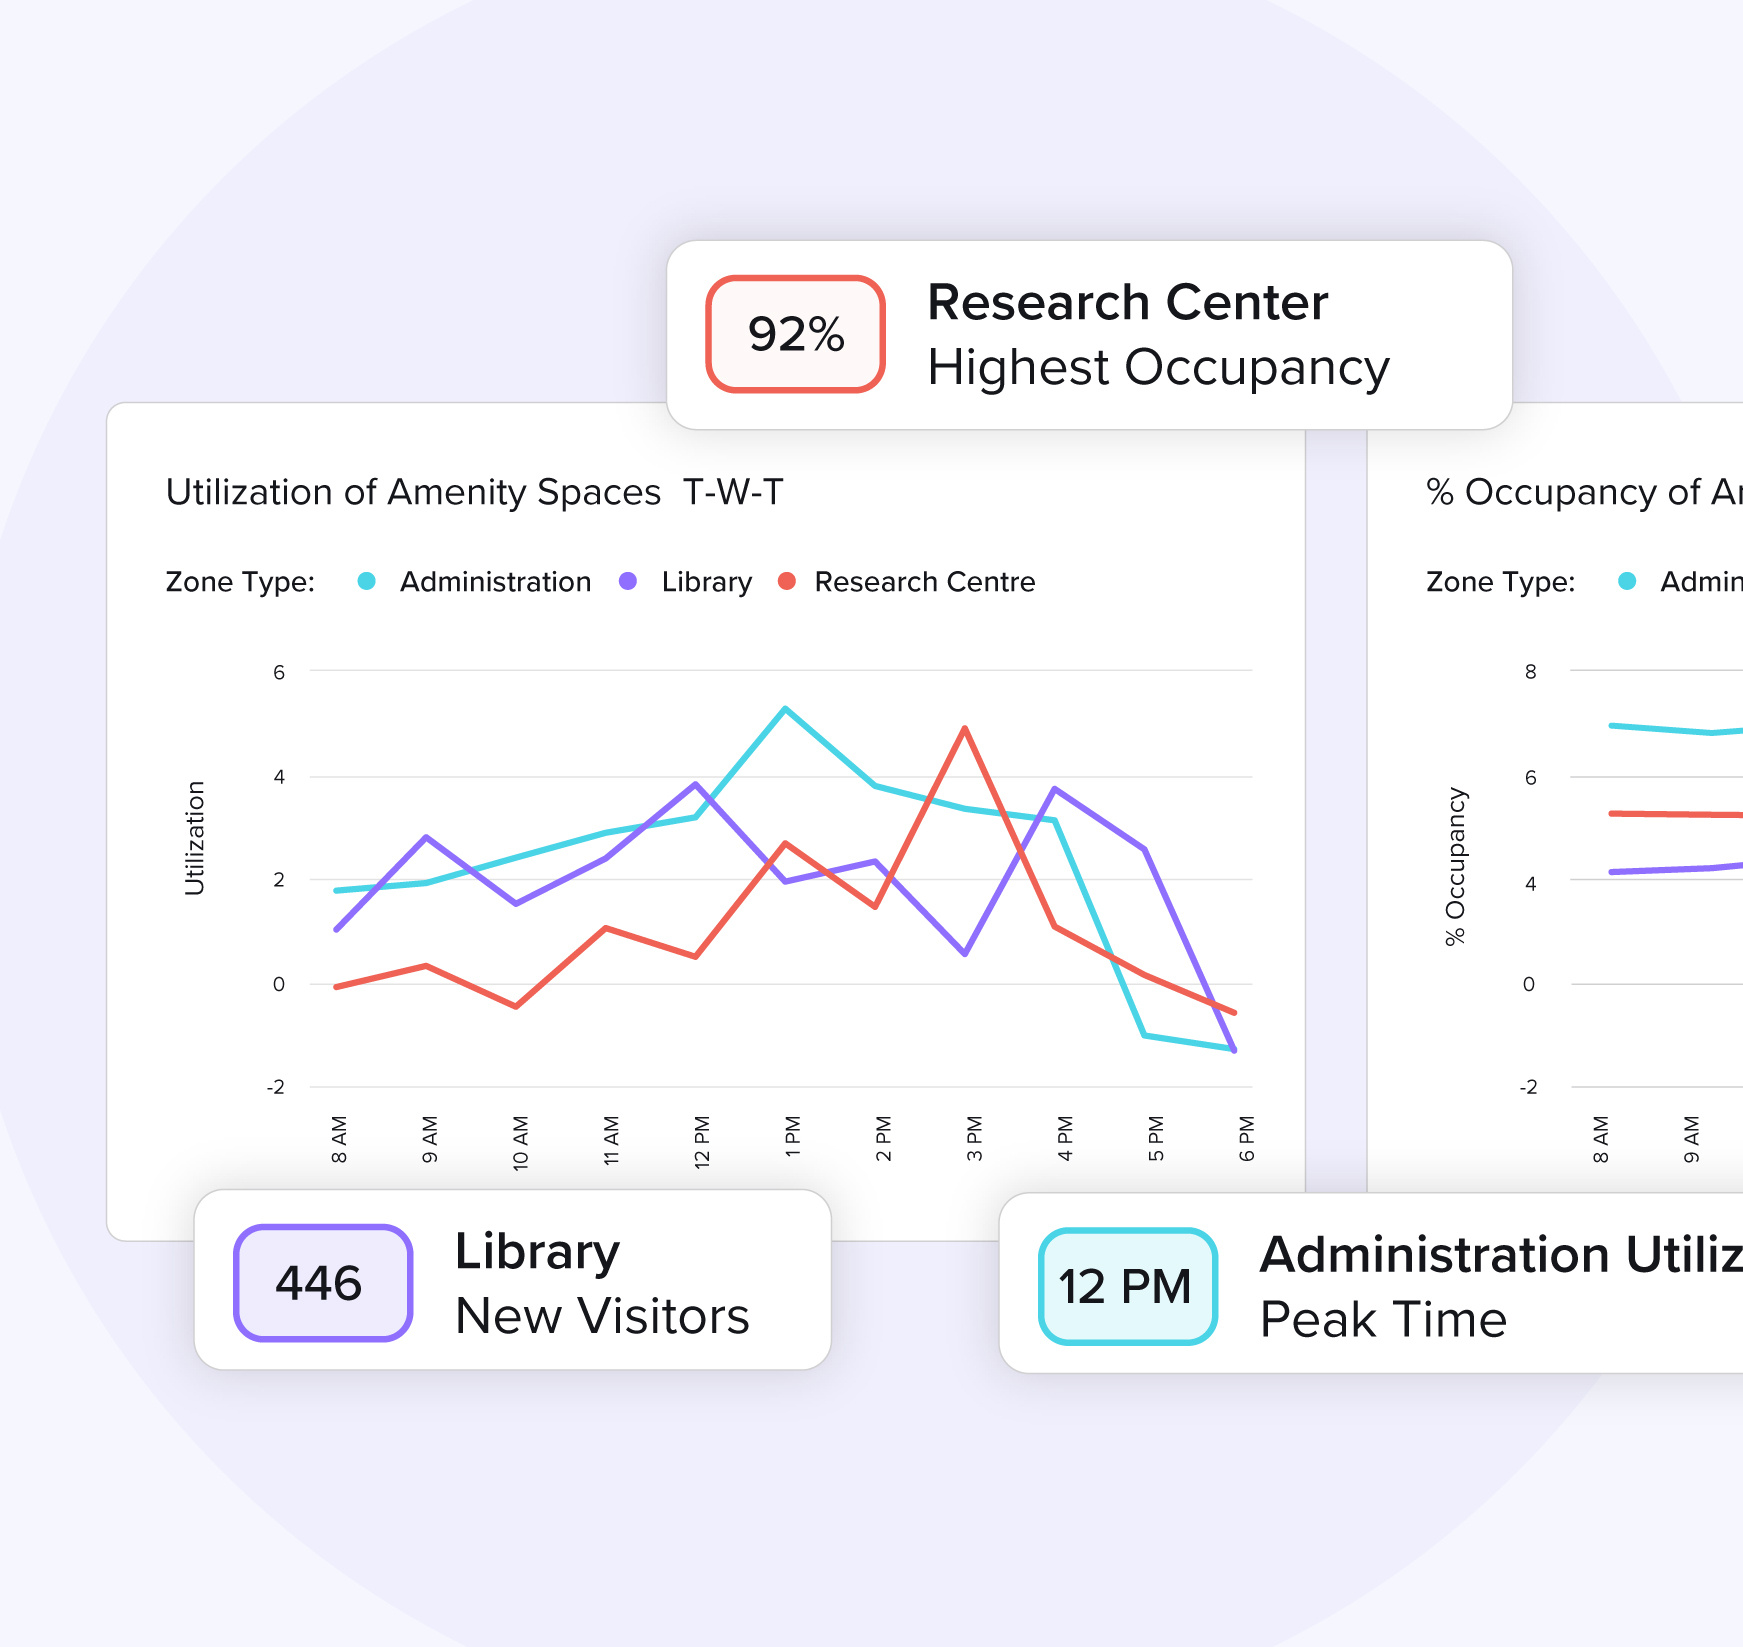
The InnerSpace Portal delivers powerful insights into how different groups use your space - unlocking cohort behaviors, departmental trends, and useage patterns that drive strategic decisions.
Key metrics include:
- Group and cohort-based behavior analysis
- Space utilization across different zones and space types
- Visit frequency and return rates
- Time on site (dwell time)
- Meeting room occupancy and effectiveness
- Pathways and foot traffic patterns
All this and more without the
need for sensors or hardware.
Show where they are going and where they are coming from
Allow traffic and density to be measured over across your entire office footprint
Understand how people use space, across floors, zones, and entire buildings, to design smarter workplaces

How to discover popular pathways in your space
Lorem ipsum dolor sit amet, consectetur adipiscing elit. Nullam tempor arcu non commodo elementum.
How to measure frequency
Lorem ipsum dolor sit amet, consectetur adipiscing elit. Nullam tempor arcu non commodo elementum.
How to know the popular times in the office
Lorem ipsum dolor sit amet, consectetur adipiscing elit. Nullam tempor arcu non commodo elementum.
How to measure people count
Lorem ipsum dolor sit amet, consectetur adipiscing elit. Nullam tempor arcu non commodo elementum.
How to measure people density
Lorem ipsum dolor sit amet, consectetur adipiscing elit. Nullam tempor arcu non commodo elementum.
Explore the power of InnerSpace metrics:
From foot traffic to distinct team behaviors
The InnerSpace solutions uses a proprietary Wi-Fi location intelligence engine to generate more accurate location data than traditional occupancy data solutions. Using Wi-Fi for this data has the ability to analyze and present all available metrics by team or group.
Discover our “inside the data” series
Custom reports allow you to measure what matters to you
InnerSpace offers a custom reports feature accessible through our analytics portal, allowing users to gain deeper insights into their space utilization data. Users can build tailored reports to capture the data you need to make informed decisions.
The platform allows you to export raw data for offline analysis in various formats like PowerPoint and Excel, as well as for use with visualization tools such as PowerBI and Tableau.
InnerSpace also provides an open and extensible API, enabling data scientists and analysts to utilize their preferred BI reporting tools for creating highly specific custom reports.

Make smarter workplace experience decisions with InnerSpace

